Invite-only beta
Ask the market anything.Watch AI draw the answer.
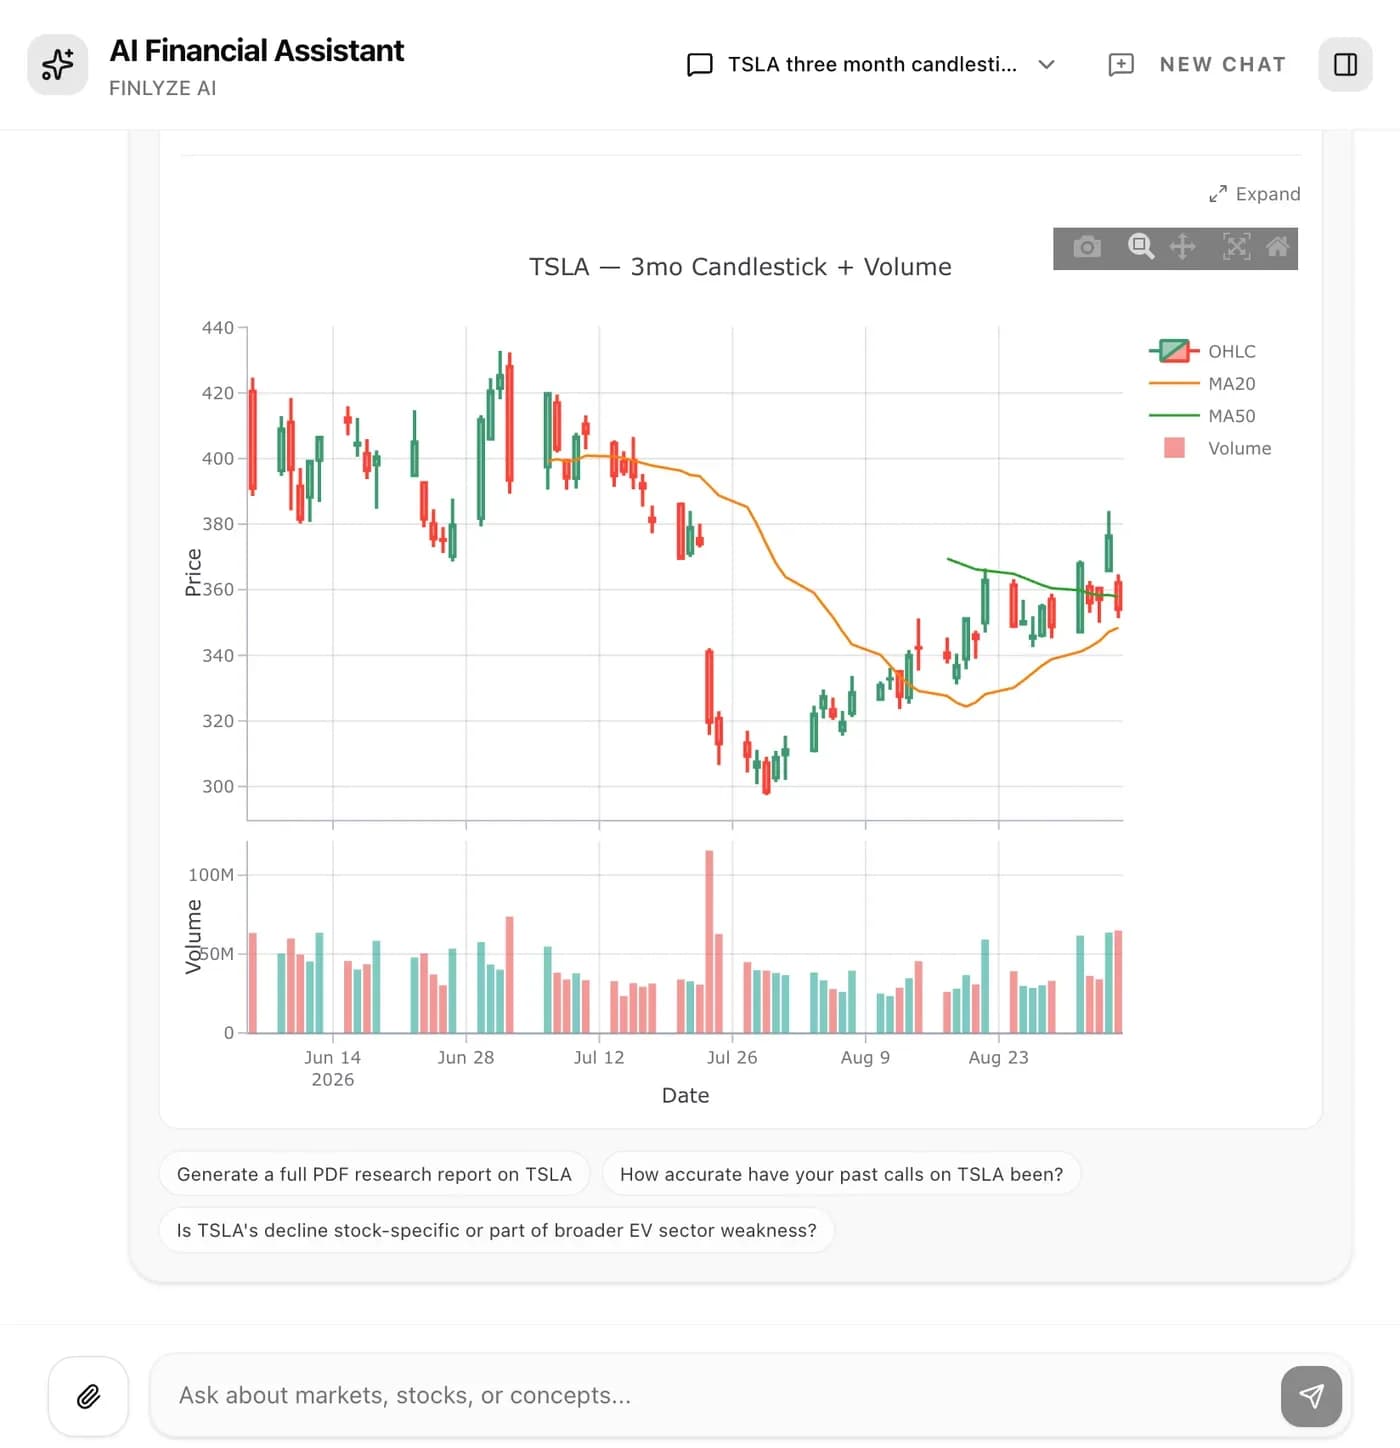
Show TSLA candlesticks for the last three months, with volume below.
Ask it anything






I want to research a stock — in what order should I look at which data?How do I tell a pullback from a trend reversal? Give the evidence for each and its limits.Compare concentrated and diversified positions, and how I should measure my own concentration.How is crypto risk fundamentally different from stock risk, and what should I watch for?Why might a stock fall on good news?What does implied volatility tell me, and how is it different from historical volatility?What verifiable evidence shows whether a company has a durable moat?How do I cross-check valuation with multiples, discounted cash flow and peers? Identify the most sensitive assumptions.How do equal weight, minimum variance and risk parity allocate assets? Explain assumptions and the data needed to compare them.How should I read real rates and the yield curve, and what do they mean for equity valuation and bond duration?Should bitcoin volatility use calendar or trading days? Explain the window, closed bars and sample standard deviation.
How can operating cash flow and debt maturities help assess a company’s ability to repay its debts?Break “is this company worth buying” into questions I can verify one at a time.List the data and dates I should verify before making an investment decision.Reading an earnings report: which numbers come first, and how do they cross-check each other?How can I tell whether a price forecast is reliable? Which uncertainty measures matter?How can correlation show whether a portfolio is really diversified — and when does it fail?How can I screen for reliable cash flow and manageable debt? Suggest testable filters and explain sector differences.What do momentum, value, quality and low-volatility factors measure, and how can I detect overlapping exposures?Why might a portfolio of stocks, gold and bitcoin be diversified by weight but concentrated by risk?Revenue is growing but operating cash flow is falling: what should I inspect to distinguish investment from warning signs?What do perpetual funding rates and open interest reveal, and why are they not automatic trading signals?
How should I reconcile conflicting revenue figures from different sources for the same company?When are P/E, P/B and free-cash-flow yield each the right lens — and when do they mislead?How do rising rates usually affect growth stocks, value stocks and bonds — and when does that break?What do volatility, max drawdown and the Sharpe ratio each measure — and what do they miss?Where might confirmation bias and loss aversion show up in my investing, and what rules keep them in check?How does a stronger dollar tend to affect global stocks and commodities?How can I distinguish an undervalued stock from a value trap using valuation, earnings quality and catalysts?How does a price range differ from a direction forecast, and how should an upside probability be validated?How can I compare volatility, risk contributions, drawdowns and stress scenarios instead of relying on one portfolio metric?Is an earnings-per-share beat always good news? Explain consensus sources, dilution, guidance and announcement timing.How do I audit a financial chart's sources, dates, currencies, adjustments, axes and model assumptions?
Features
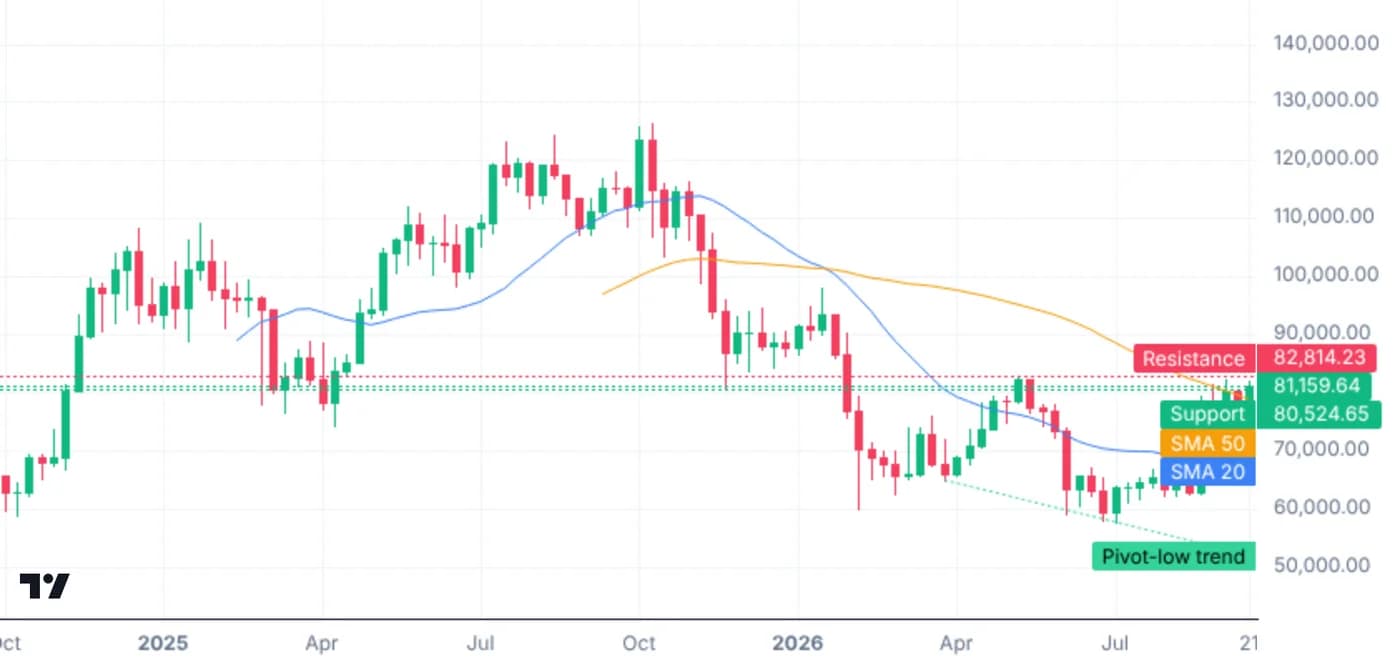
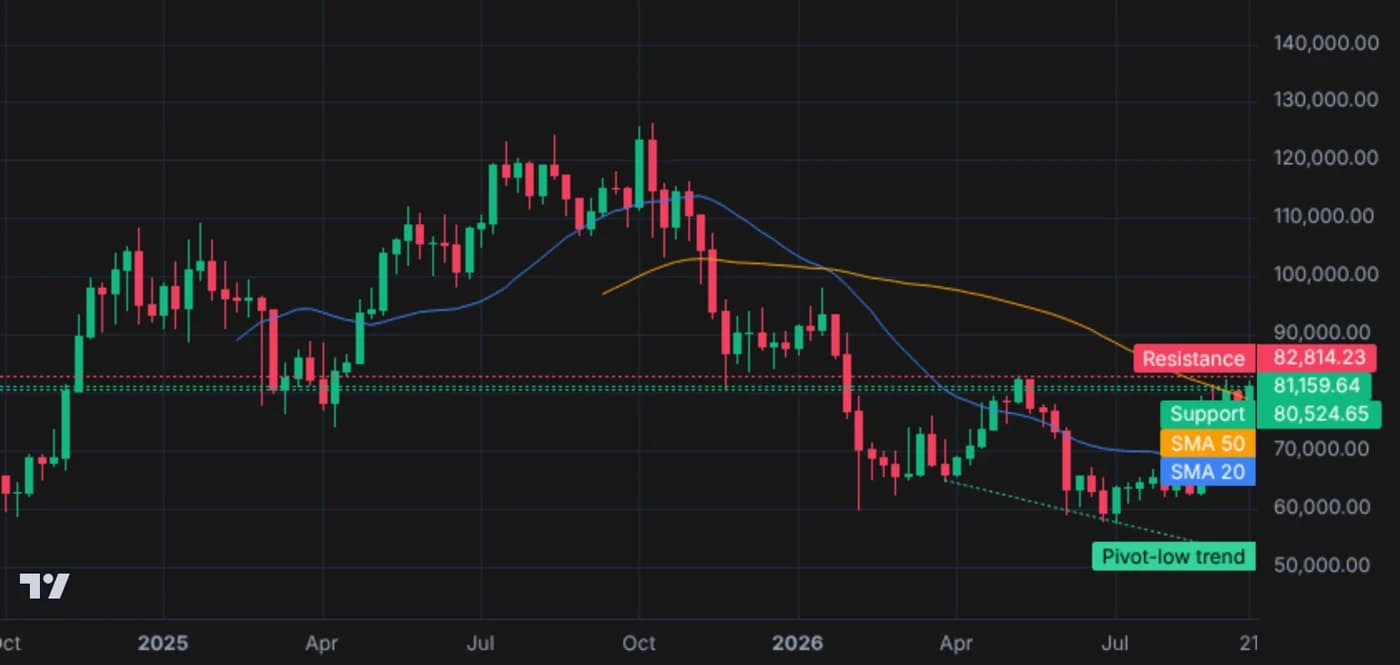
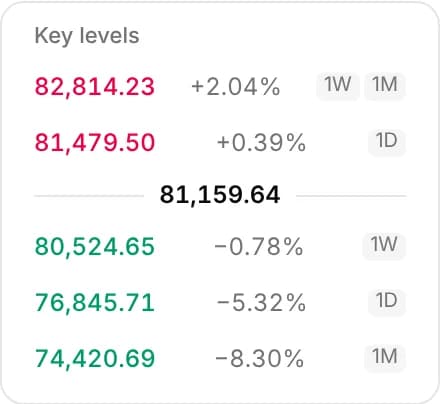
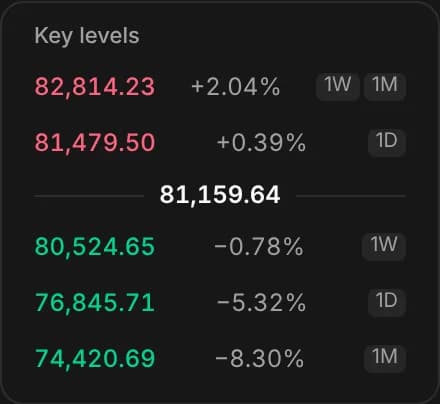



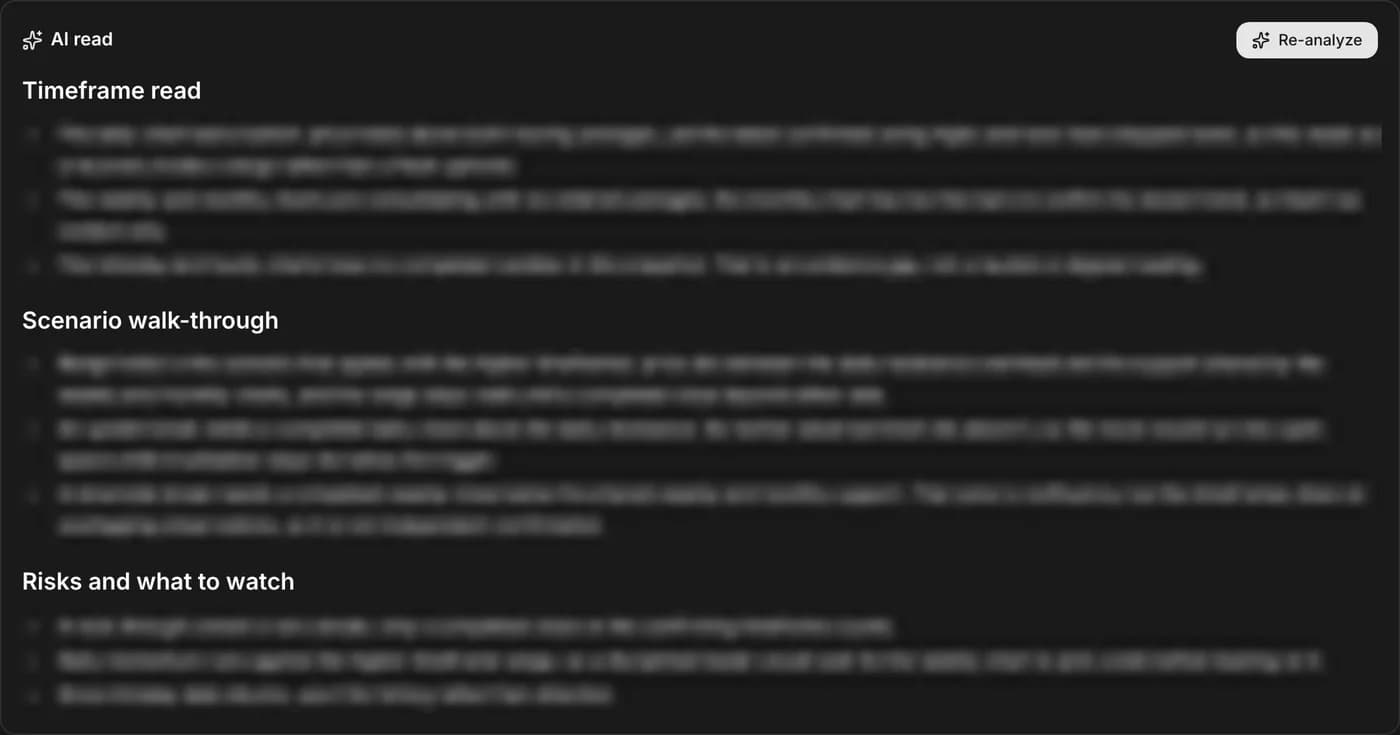
Chart analysis
Chart analysis: BTC-USD on the weekly view with its support, resistance and pivot-low trendline marked, the key levels, three scenarios (range holds, upside break, downside break) and the AI read's sectionsInvestor debate
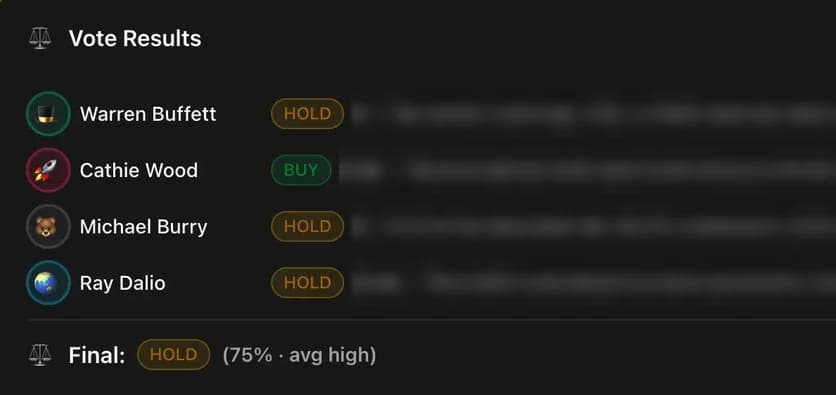
Debate Room vote results: Buffett hold, Wood buy, Burry hold, Dalio hold, final tally hold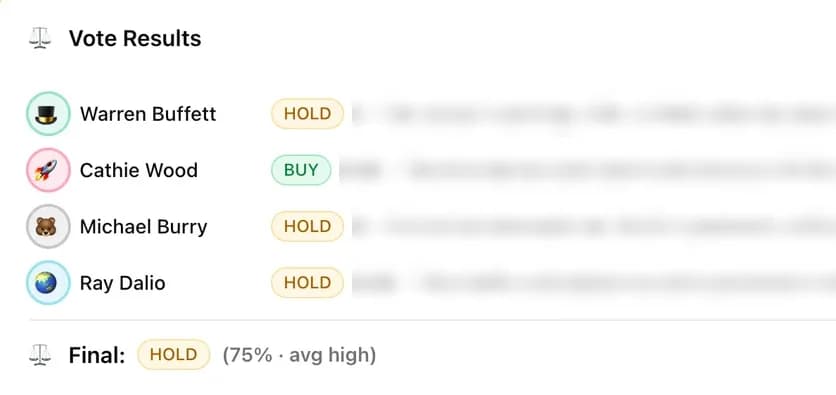
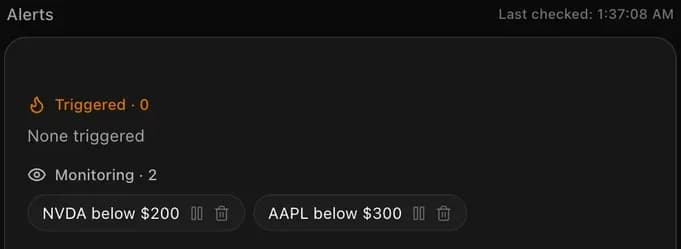
Live watch & alerts
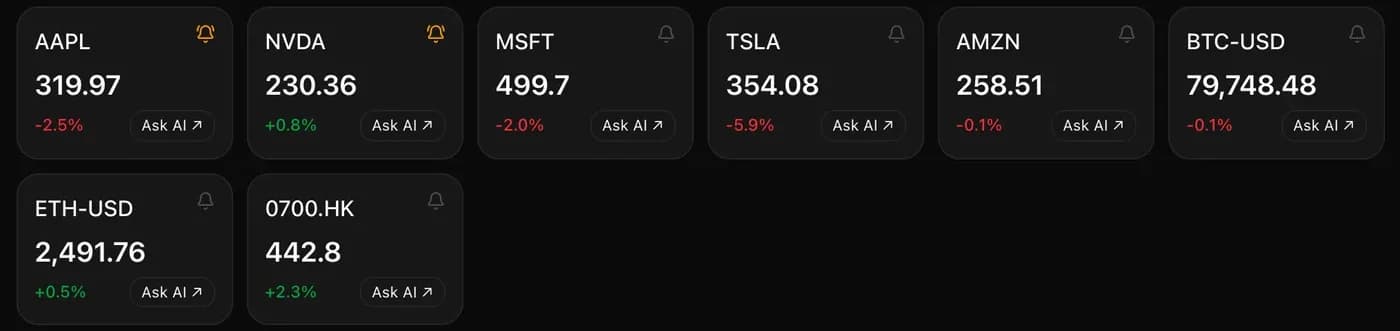
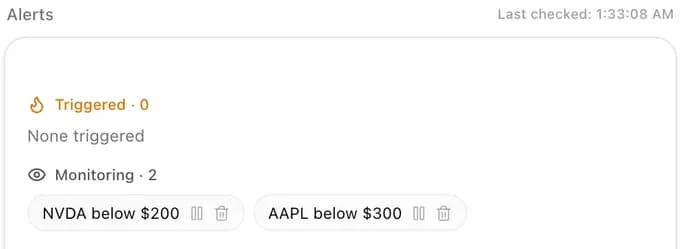
Live price cards with an Ask AI button on each, and the alerts list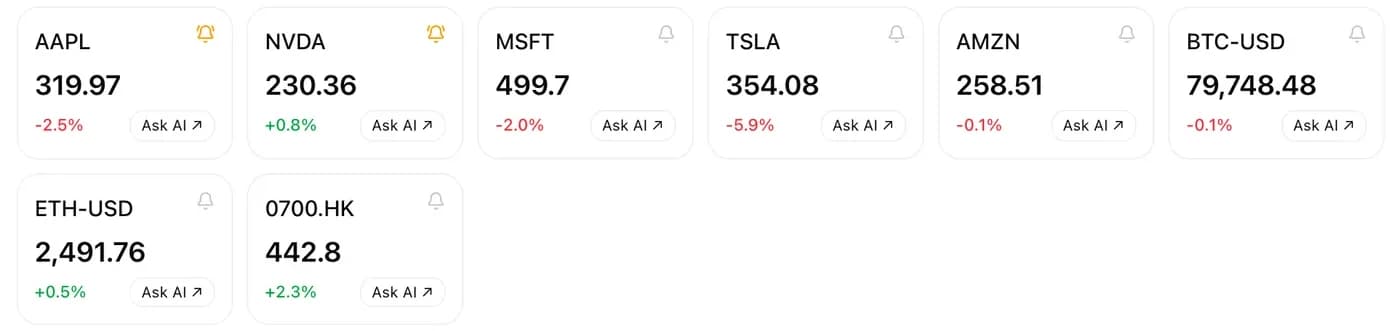
Investor personas
Six of the built-in investor personas, each with a one-line description of the investing style. Personas are AI models of an investing style, not the people themselves.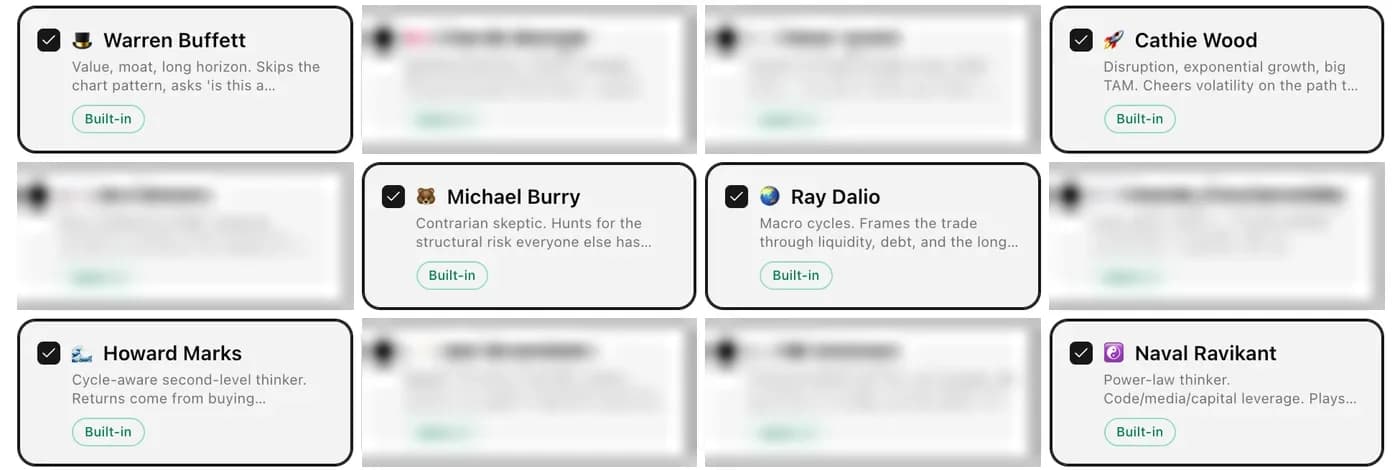
+6 more